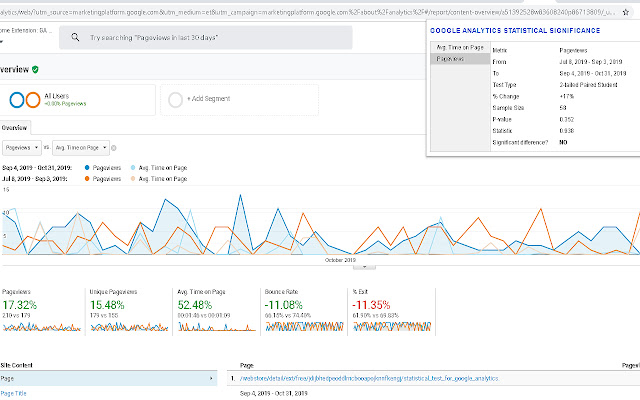
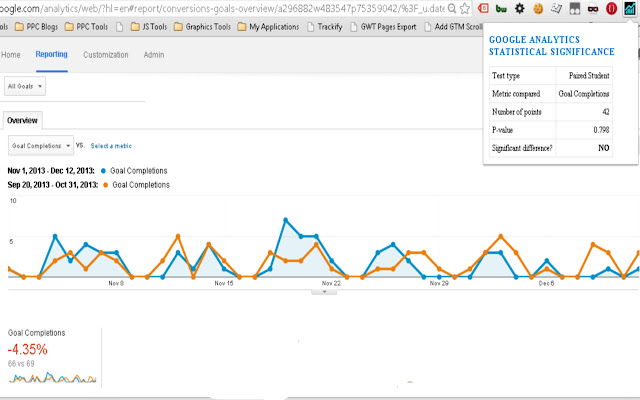
One very useful feature of Google Analytics is the comparison of timeframes for metrics. You can compare number of sessions, bounce rate, E-commerce transactions, AdWords cost, etc. between adjacent weeks, months, or years.
One shortcoming in this comparison feature is that the percentage change calculated by Google for these metrics is not qualified. This extension addresses this shortcoming by evaluating the change between time periods for statistical significance.
Currently, for 5 < points < 40 the Wilcoxon Signed-Rank test is used. For points > 40, the paired Student's t-test is used.
Release Notes:
Version 3.1
* Separate tab for each metric; support multiple metrics on graph
* Should support metrics from line graphs on any page
* Reload button for when extension misses capturing data
* Also show date range and percentage change for metric
Version 2.3
* Update calculation of Wilcoxon statistic (used when n<40) with port of SciPy implementation
* Styling changes
* Warnings added and other fixes
Version 2.1
* Versions 1.* were broken due to changes in Google Analytics. Updated data extraction to pull directly from Google's web requests, rather than calculating from the DOM. More accurate and robust
* When you change the dates or metric on a chart, it will automatically recalculate
Limitations:
1. Time frames to be compared should begin on the same weekday (Monday and Monday or Friday and Friday), to minimize confounding factors in the comparison. They should be the same length of time. Be careful to ensure this, especially for year-over-year monthly comparisons. This script derives its statistical power by treating metrics as paired data points (based on the day of the week).
2. Must compare at least 5 data points (days, weeks, or months). Beyond the lower limit, the statistical test lacks sufficient power.
For further documentation and description of the statistical tests, visit https://noahonnumbers.com/blog/entry/statistics-google-analytics
Extore is a team of professionals who are passionate about creating extensions for web browsers. This devotion also gives us opportunity to appreciate work of other people. We get inspired by useful, open source extensions made by developers all over the world. Our strong belief is that one should share helpful add-ons with others. That’s why we’d like to present you our ever-growing list of favourite extensions that have inspired us. Moreover, as you probably have already learned, sometimes struggling for the best brings an end to the good. Talking about add-ons it often turns out that an upgrade is worse then previous version. Also it can become really tricky to get back to the beloved version of your favourite extension. That’s why we’re going to make not only the latest, but all versions of our favourite (and we hope yours too) add-ons available for download. No more compromises, just stick to the version you really like!
 Preparing download link, please wait for seconds
Almost done...
Click to download
Error getting file. Please try again
Preparing download link, please wait for seconds
Almost done...
Click to download
Error getting file. Please try again