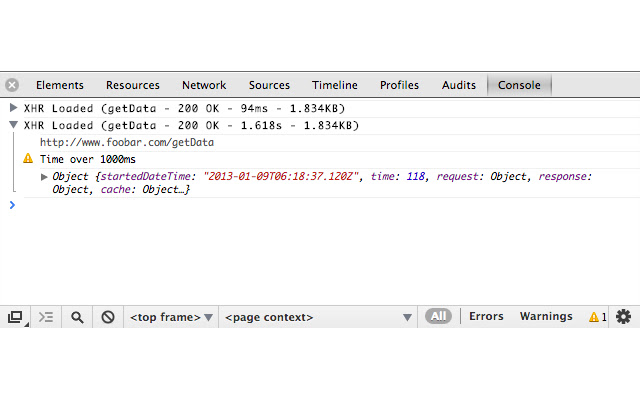
AJAX Debugger will log all AJAX (XMLHttpRequest) activity to Chrome's Developer Tools Console. This allows developers to easily see top-level request info, like the HTTP status, response time, and size. Click the URL to open the AJAX call in a new tab, including all the inputs, making debugging much easier. You can even drill down to see all the low-level request details including the HTTP header information.
Logged data includes:
• File called
• Response Status
• Response Time
• Response Size
• AJAX source link with all input params
• Object containing all request and response details
• Response content (optional)
• Warning if response takes longer than set time
Logo & promo design by Andy Merskin <www.AndyMerskin.com>
Extore is a team of professionals who are passionate about creating extensions for web browsers. This devotion also gives us opportunity to appreciate work of other people. We get inspired by useful, open source extensions made by developers all over the world. Our strong belief is that one should share helpful add-ons with others. That’s why we’d like to present you our ever-growing list of favourite extensions that have inspired us. Moreover, as you probably have already learned, sometimes struggling for the best brings an end to the good. Talking about add-ons it often turns out that an upgrade is worse then previous version. Also it can become really tricky to get back to the beloved version of your favourite extension. That’s why we’re going to make not only the latest, but all versions of our favourite (and we hope yours too) add-ons available for download. No more compromises, just stick to the version you really like!
 Preparing download link, please wait for seconds
Almost done...
Click to download
Error getting file. Please try again
Preparing download link, please wait for seconds
Almost done...
Click to download
Error getting file. Please try again